sheet2graph command-line program
sheet2graph command-line program
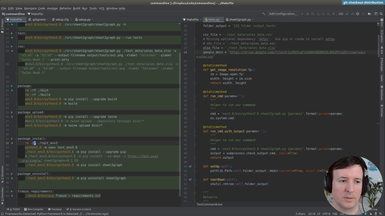
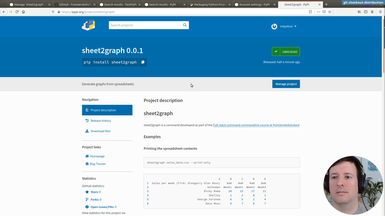
8 hoursWe implement our own command in Python and distribute it via pip with pip install sheet2graph.
The command takes spreadsheets files (csv, xlsx) as input, and generates images (png, jpg, svg) based on the data contained.
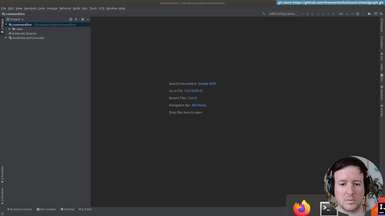
Clone the repository
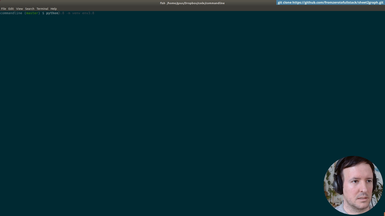
git clone https://github.com/fromzerotofullstack/sheet2graph
and get the episode branch
git checkout load_csv
Episodes
Ep.1 - Introduction, repo features and environment
(17 minutes)
We explain how the project will be structured and what we are trying to accomplish.
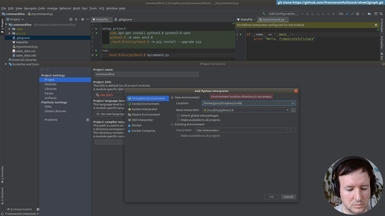
• Settings up the project
• Configuring a virtual environment
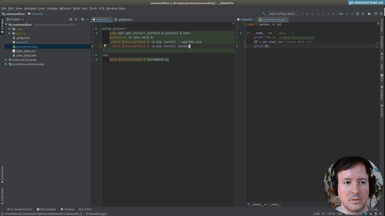
• Making a simple command that outputs a string

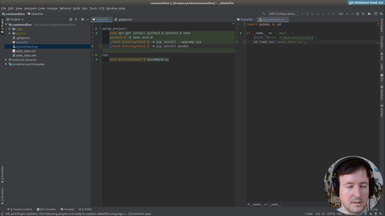
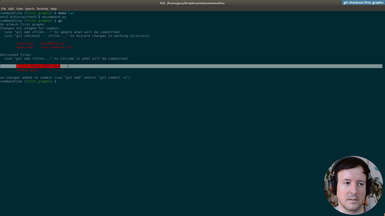
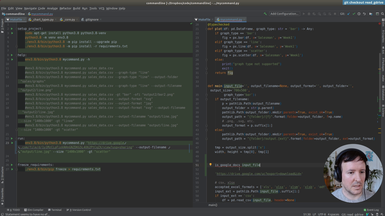
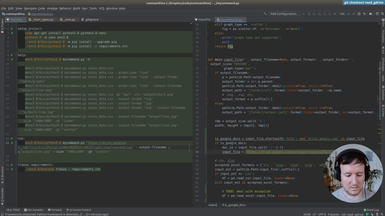
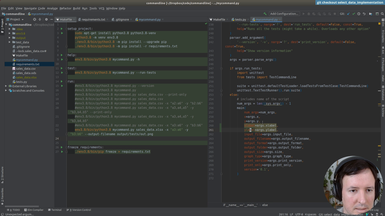
Ep.2 - Loading csv files
(8 minutes)
We create a Virtual environment and setup the project.
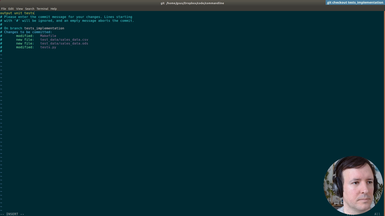
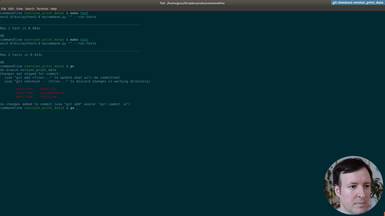
• Organizing commands with a Makefile
• Creating our Virtualenv
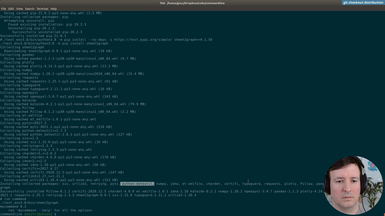
• Installing packages
• Using requirements.txt
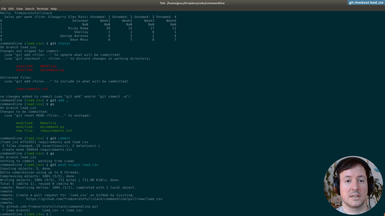
• git branching
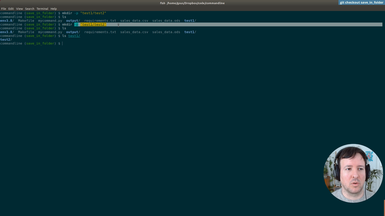
Ep.3 - First graphs
(19 minutes)
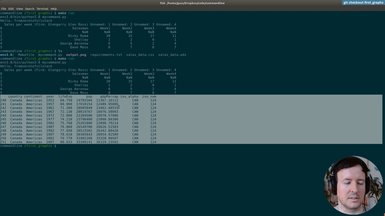
We save out first graph from the spreadsheet data.
• Installing Plotly to generate graphs
• Pip freeze requirements
• Solving dependency problems
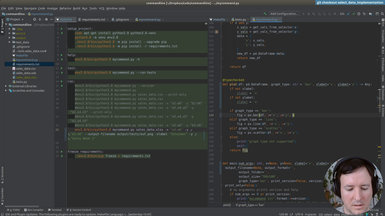
• Using Pandas to do simple data processing

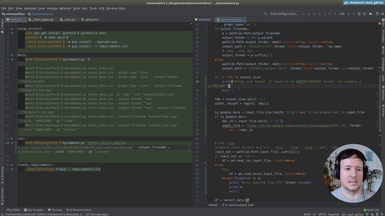
Ep.4 - Saving in a folder
(5 minutes)
We will create a folder to save our image to.
• Saving the image in a folder programmatically
• Using Pathlib
• Add folder to .gitignore
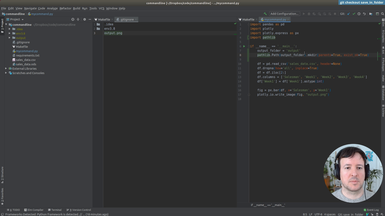
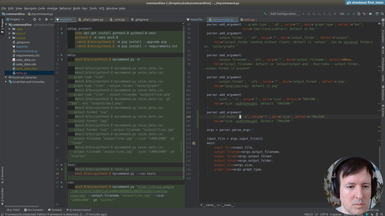
Ep.5 - First commandline options
(19 minutes)
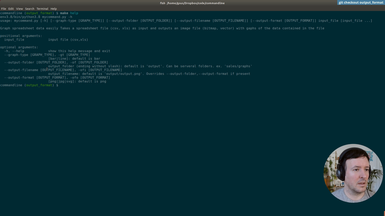
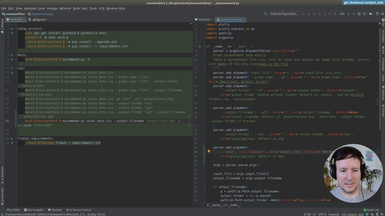
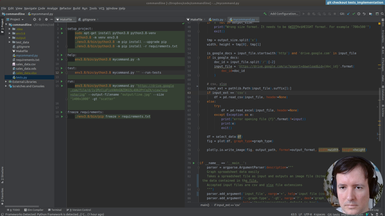
We will add our first command line flags/options.
• Using argparse to parse commandline arguments and generate help
• Optional and required flags
• Add input file and graph type options
• Graph different graph types
• autogenerated help
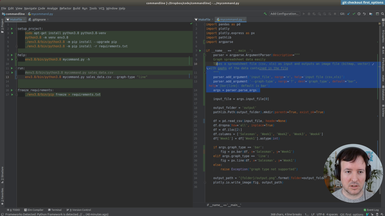
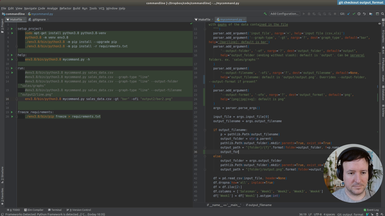
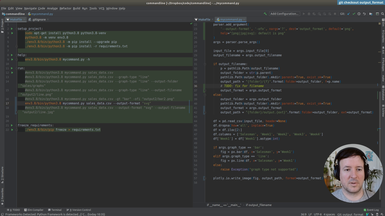
Ep.6 - Output options
(22 minutes)
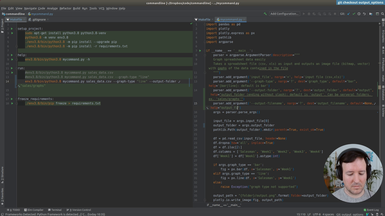
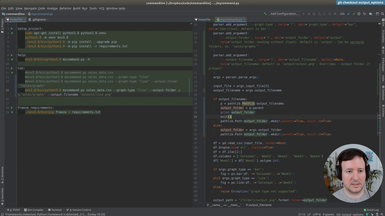
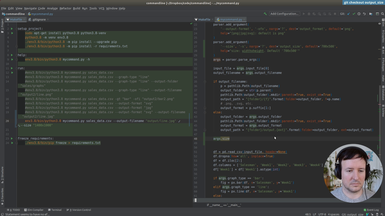
Here we add an option for different output locations.
• Using argparse to parse commandline arguments and generate help
• Combine options to output with a filename and with a folder
• Precendence of command flags
Ep.7 - Output format
(13 minutes)
We add Scalable Vector Graphics (SVG) output support.
• Add several output formats (svg, jpg, png) to our command
Ep.8 - Generated image size
(6 minutes)
We will add output options to specify the size of the generated graphs.
• New option for output size
• Default and custom graph sizes

Ep.9 - Refactoring and type checking
(22 minutes)
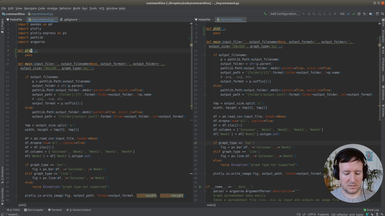
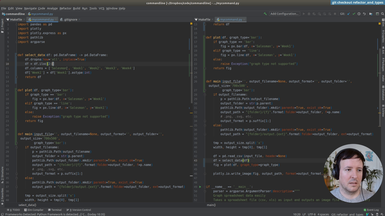
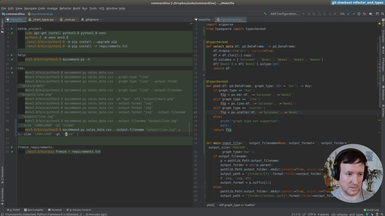
We start refactoring what we have until now, and add type annotations.
• Add basic annotations to functions
• Use Typeguard to enforce the annotations at runtime
• Annotations as a kind of documentation
• Add a new type of graph: the scatter graph
Ep.10 - Reading excel files
(16 minutes)
We will add support for Excel files (.xlsx).
• add dependencies: Openpyxl and Xlrd for Excel support
• Fix type errors

Ep.11 - Reading a file from Google Drive
(15 minutes)
In addition to a local file (.csv, .xlsx), we accept a Google Drive public document as input.
• Parsing the url address of the Google Drive document
• Adding the input option transparently for the user
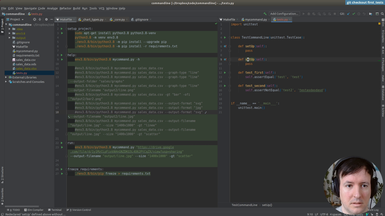
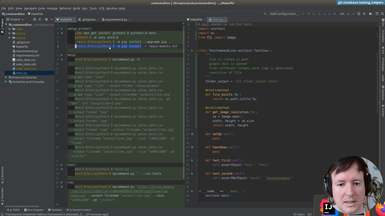
Ep.12 - First tests
(16 minutes)
We will setup testing in our project to check the features we implemented.
• The unittest module in Python
• Add a test target to the Makefile
• Test loaders
• Assertions in testing
• Adding tests cache to .gitignore
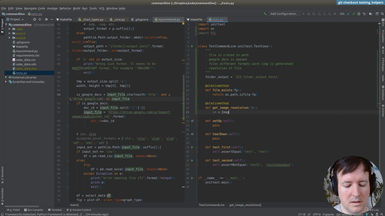
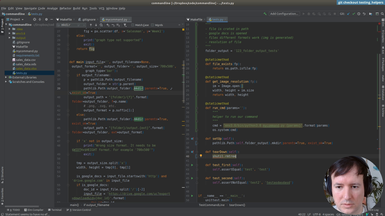
Ep.13 - Testing helpers
(16 minutes)
Once we have the infrastructure for testing, we will write a few helpers to make the tests more concise and easier to write.
• Setup and teardown in a test suite
• Using Shutil to deal with filesystem operations
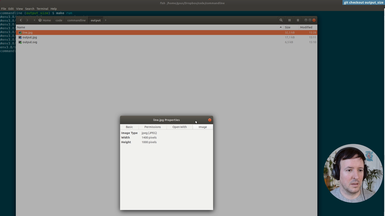
• Checking that a file is created in a specific path
• Checking the size of an image with PIL
• Running a command line application from a test
Ep.14 - Writing tests
(32 minutes)
After the testing infrastructure and helpers are ready, we are writing the tests for our commandline application.
• Testing input files
• Testing location of output files
• Testing generated image sizes
• Testing graph types

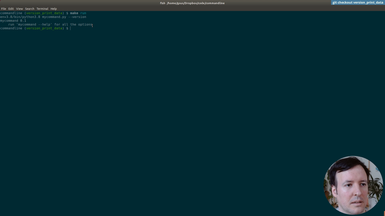
Ep.15 - Print version
(24 minutes)
We will be making our command a bit friendlier, improving the default behaviour with informative messages for the user.
• New option to print help of command
• Print version of the command
• Default behaviour. No flags prints the version and exits
• Testing the output of our command with os.system and subprocess
Ep.16 - Print data
(33 minutes)
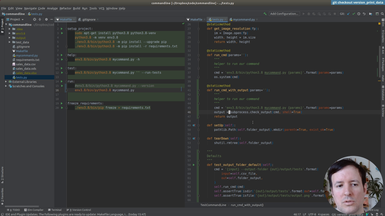
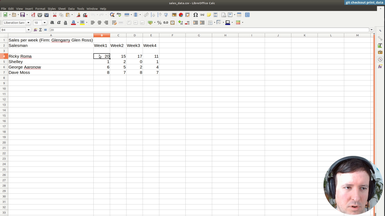
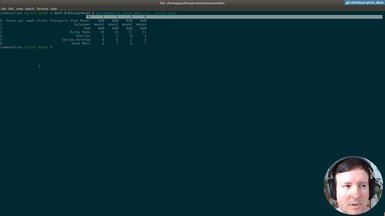
After using hardcoded column names, we will start making the spreadsheet processing generic. This way our command will work with any spreadsheet file. The first step is to print the data of our input file, so the user can preview it.
• Print-only option to print the input file provided by the user
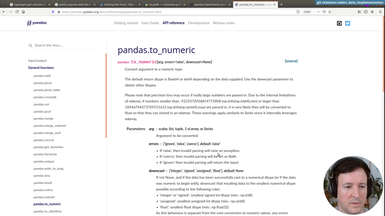
• Transforming the data with Pandas to index it by letter and 1-based integer (as in spreadsheet applications like Excel)
• Adding tests for the new indexing by letters and integer for columns and rows
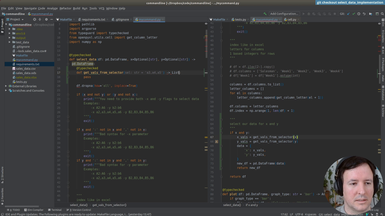
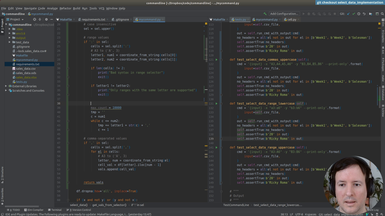
Ep.17 - Testing data selection
(1 hour 3 minutes)
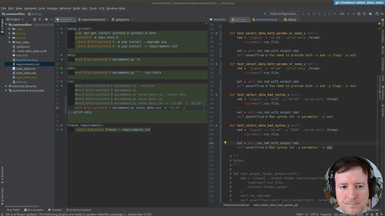
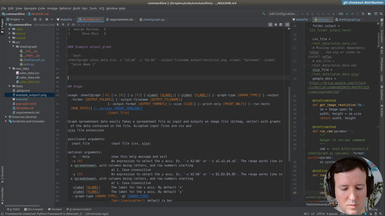
For each axis, we will allow the user to use expressions like 'b4,b5,b6,b7' or 'B4:B7' to select cells or ranges to graph.
• Add options '-x' and '-y' to select the data to be graphed
• Making the expressions case-insensitive
• Implementing a comma separated selection option
• Implementing a range selection option
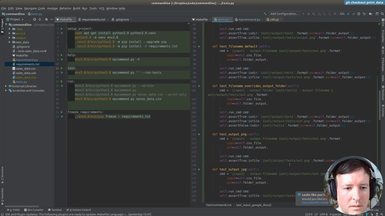
• Adding tests first and making them pass after implementation, as in Test-Driven-Development (TDD)
• Better and more informative user messages in case of error
• Verifying and fixing problems in our Pandas implementation
Ep.18 - Adding labels to graphs
(25 minutes)
We will check everything is working so far and add extra options to set the axis labels to a custom user-defined value.
• Debugging broken tests and making all tests pass after all our changes
• Adding an x label and y label options to our command, to specify the labels in the horizontal and vertical axis
• Debugging column types in pandas
• Using exceptions to deal with unreliable cases
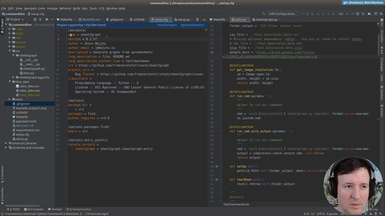
Ep.19 - Distributing our command
(57 minutes)
We will start preparing our command for distribution in pypi for it to be installable with pip, and testing the distribution in a test environment.
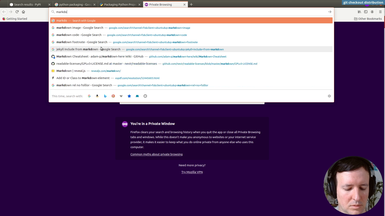
• Finding a proper name for our command
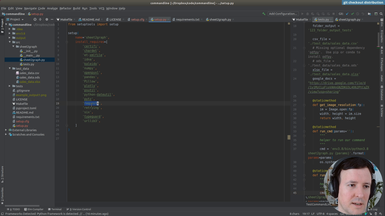
• Folder structure and necessary files
• Changes in the entry point of our program
• Generating a good README file in Markdown
• Examples and documentation
• Choosing a license
• Dependencies and versioning
• Setup.cfg and setup.py
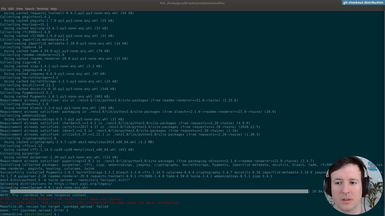
Ep.20 - Packaging and uploading
(20 minutes)
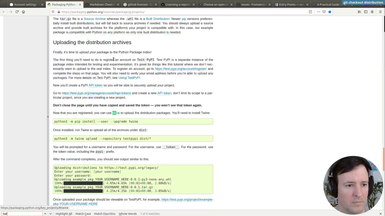
We have all the files. We will test the distribution at test.pypi.org before publishing it in the real repository. This way we will be able to fix any mistakes.
• How to test in the test.pypi.org environment
• Using Twine to distribute your module
• Creating a new account at testing (test.pypi.org)
• Secure tokens in .pypirc or interactively for testing
• Versioning increases with each code change
• Fixing errors and testing the new version in the test environment
• Problems with images as documentation in the README file
Ep.21 - Testing install
(19 minutes)
After testing at test.pypi.org, we will fix an error with the example image in the documentation and distribute our command 'sheet2graph' to the real production environemnt at pypi.org.
• Fixing error with images in README.md at test.pypi.org
• Creating a new account at production (pypi.org)
• New secure tokens in .pypirc or interactively for production
• Solving problems with secure tokens
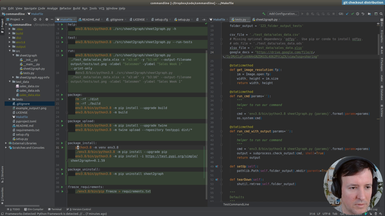
Ep.22 - Uploading to production
(6 minutes)
In this episode we put everything together and install our own command by typing 'pip install sheet2graph'. We test it both in a virtual environment and globally. We also talk about what this means to distribute code you develop easily to the world, something that now should be a lot more approachable. As always, we need to be mindful of publishing useful and tested code, and in general to play well within the ecosystem.
If you made it here I hoped you liked it. Subscribe or Connect with me on Twitter for updates on fromzerotofullstack.
• Solving problems with secure tokens
• Installing our new command using pip
• Testing on a new virtual environment
• Etiquette of publishing your modules and libraries