sheet2graph command-line program
Ep.16 - Print data
33 minutes
After using hardcoded column names, we will start making the spreadsheet processing generic. This way our command will work with any spreadsheet file. The first step is to print the data of our input file, so the user can preview it.
• Print-only option to print the input file provided by the user
• Transforming the data with Pandas to index it by letter and 1-based integer (as in spreadsheet applications like Excel)
• Adding tests for the new indexing by letters and integer for columns and rows
Transcript
so now we're gonna start taking a look at one
of the things that we have neglected until now
so basically we have our whole program it has tests with a decent coverage
and the one thing that we've been ignoring is this select data right
so basically we take some input we select part of that data from the excel
file and spreadsheet and then we plot it but there's a
problem with these two parts and the problem is that this is hard
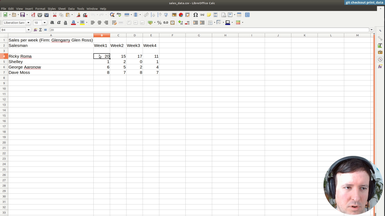
coded to our data so here it says it says salesman
we also in the processing of the data we are just hardcoding that the columns
are salesman week that week one is an integer we're
removing the first two rows so all of this is tailored to the
file that we're using right this sales data
like this file here so we don't want this we want people to be
able to to use their own files otherwise it's not very useful so to do
this we're gonna first of all find a way for
people to print the contents of the file without
having to open excel here or open office or libreoffice
or anything just from the command line so what we're
gonna do is that somehow the user types here like
my command and sales data and that this uh
prints at least a summary of the data or if possible all the data
and then with this information the user will be able to select which data from
the one he's seeing or she's seeing they want to graph so let's go ahead and
create a new branch for these changes and we're
going to call it print data
okay we're open data and then we can start thinking on how to do this
so first of all um all these changes will happen in
well before we deal with select data let's focus on the printing thing right
so we're gonna add an option to print the data so it will be
something like print print maybe like print only
so something like this so this will print the data
and um for this we're gonna just add it as an argument like everything
else so let's say for instance
let's say here we'll add a print only
and let's add also a short version okay the default for this is false
so we'll change it here to false and
then um yeah of course this is like a boolean
value so this means like equals true and some help
so let's say brains just select data
without generating any kind output right so people are
going to call this print only and this is going to generate
like a print of the csv of the excel file
and it's not going to graph anything so this is just to explore for people to
explore the the contents of the file so let's take
this print only and add it to our main
method as a parameter and then of course in here
it doesn't really matter the order but here
and by default this is false okay and
exactly and print only i'm just checking yeah so basically
what we want is to get this another print version but the print only
and when we get to this point where we have read
the file we can print it right so here we can do if print only
and then we want to print it and exit so for now we can just print the data
frame and return
let's see let's see if this works um we need to print only we also need a
name for the file right so it's going to print whatever file we
pass as an input so something like this
exact so let's run this or like make run
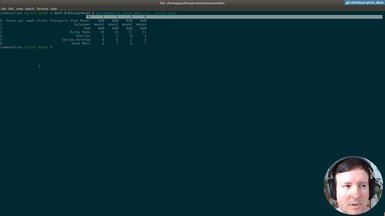
exactly so this is working it's printing the the name of the file correctly
as you see here there's like all the numbers
even these so that we could clean it up a bit but for now it's printing really
the same as as we can see in the csv so this is
really what we wanted because we don't want people to
have to open excel to then select uh they want to graph
because otherwise they can just use excel to graph it right
okay so here we see the sprinting and there's a couple of things we can
improve on here first is that um if you run
just this okay it has generated the image
but uh it would be useful that if you run it like this with no options it just
prints also the contents because then users could explore like they type like
my command sales data says that the tool and they
can they can take a look at what is inside and only after they are
decided they go like oh graph type bar or something so
what we want to do is to make this behave the same
as the print only right so um first of all we can commit this what we
have uh so this is like
uh we'll probably option okay and then um
and then let's try to to do the print only and this is done and
without it it should do the same so like this should do the same so let's
take a look at the code and we want it
to do the same as this and let's check it it shouldn't be very
complicated because we're in the in the main method here we're doing
exactly what we want so one way to do this uh would be
here we have the number of arguments and we have the input file
so what we can do is if let's say if the number
of arguments is just one so if we get literally this input file only then we
can do something with that so let's say if numbers
equals one and there is an input file okay so just make sure
then we can set the print only flagged through
so here we are forcing the print only flag to draw right
so it will still go here so that that's gonna be pretty good
and then also we don't want to output anything yet so all of this
output part we could we could skip so yeah we could skip all the output
parts so maybe we say if not pretty importantly
so only if print only is not set we bother about the output right because we
don't want any output we just want to print the data we still need to deal
with the input because we need to print the data that we
read from the input but this should work and maybe here we can add some comment
just to be sure and just as an extra documentation so
this should uh should work we're using the num rx which is one
because there's one this one and then the input file needs to exist
so it's like two two ways of checking the same thing
and then we force the print only to draw even if it's false
and then this will end up here print and return
so let's give it a five is this make run that's it
okay so it works so basically right now this exactly works the same
as this perfect then um we might want to
to test this but maybe we can put it together with another
feature so we can we can commit this okay so we have these files
and this can be um okay now um i'm trying to test this so
we will test this but uh first let's test it together with
another uh feature so basically the last one i want
to to do here is you know when you check an
excel or any spreadsheet program you see here on the the columns are
named like letters right and the rows are named
uh like as numbers right they're indexed by numbers
and if you go far enough these letters start being like two letters
and it continues like this so you can refer to a
to a cell i'm sorry this is obvious but you can refer to a cell as like
b4 or c5 etc and thanks to this we can do
formulas like or selections maybe like
selecting like a range see something like this like before to
e4 things like this so this is how we we
will implement uh selecting because people familiar
with spreadsheets they all use this uh this syntax so
we'll implement something like this for our
selection and before we implement that in the next videos uh we would like to
see this information also right so when we print it
and when we print it with this we don't want to see here like zero one
we want to see abc and also here we don't want to see
zero one where this is starting with one because if you see here this detail that
this starts with one it doesn't start with zero
so let's modify that in the print function and after that we can start
selecting the data so let's take a look uh first of all
we're gonna need uh quite some um like some logic right to deal with
this like um i wonder if maybe we can start
with the test this time so
what we want to test isn't going to be like 100
tested but it will help us so we want to test
what happens and this is why i mentioned that we test it together
okay what happens where there's only input right
so when there's only input we want to test
when to print this but with numbers with numbers here starting with one for
the rows and with letters for the for the columns
so we're going to test both things here in this test
um so to do this first we need an input file
so let's take the command from this we need a command with just an input
file right so the
out folder it's just gonna be the input file
and then we're gonna pass this command to the
run command with output because we want to capture the output
and then we're gonna test that output so that output
should have something like this but here should have some letters abc
so at least at the very least it will have
a b c d and e and then it should have like one two three four
so um let's see we can test this first of all um
we could test that there have been no files created
so because this is uh the input doesn't create any file right
it says in the help already we added it it says
prints the selected data without generating any file output so let's test
that there's no file output so for this
uh no files created we're gonna get a list of the files
created in the output
so we can use this function list there it lists
the file inside the folder and we'll pass the folder here
this list there we can check the documentation also but
it basically does this sorry here
okay not from this but let's say from the python reference
yeah returns a list containing so it's a list returning the names of the enters
in the directory even by path so basically with this list
we're gonna do the length of this list and then we will know if
if there were any files created right uh which and the list should be empty
because this we're not writing anything to this folder
so uh what we can do to test this is we're gonna
do this condition no files created which will be true or false
and then if files created which is a list
is the empty list then it means no files were created
so this would be true and then we can just use this in the assertion
answer through no files created so these tests
that no files were created is also self-explanatory with the name of the
variables and then uh let's add an additional
thing it's not like a hundred percent test but it will
it will keep some some reasoning uh which is um let's test that
at least in the output there are the following characters a b
c you got the idea right so uh basically it's just a test that
we have at least like one you know like the first uh the first
column and rows indexes so this doesn't guarantee like
but it's a good heuristic like if for whatever reason at some point
this output stops having a b c which it doesn't have now but it will
have here in the top then it means something broken like it
should have these letters and the same with the numbers for
whatever reason there's no numbers here it means
something else there's an error there's like a i don't know like some kind of uh
error that is blowing up before so we need to test
something like this and we don't want to write like
just do like a list comprehension so you know you can do like for element
in this and then we could do we can complicate it even a bit more and
we could say like so for element this is
element in out so out is this the output of the command
and this could be saying for each element of this list
put the value in element so here and then is that inside
out inside the output and then we want all of this to match right so for this
python has this useful method called all similar to any
but here all of them need to match so not just one of them
and basically this will be true if all of them are found
so this is a nice trick and with this we can use the assert true
in just one line we test all of these conditions
okay so this would be a decent test test only input right
um yeah let's comment the rest of the tests for now
it's going to be a bit faster and this test will fail now but let's
run it and this is the way that a lot of people
like to do it where they write the test first and then they
make it pass so we're giving the file here this
test-driven development this is only of course it's
a very complex topic but uh but basically this is like the basic
basic idea of it so let's run the test and see how they
fail exactly so it fails right first because
it's a bytes like object not string so i forgot about
this um so all of these need to be like byte
objects why because the output the way this
run command with output works it's using subprocess and
subprocess is getting a bytes object from the
terminal command so because of this in python 3
strings are like unicodes so we have to say this is a byte string
so with this at least it should be failing but not because of this
exactly so now it fails because false is not true not because
it's blowing up so let's make let's make this test pass
so what do we need for this let's go to the command
and here we're gonna need in the select no in the print just a second
we're gonna need to change something in the print right we're gonna need to
process this somehow before this print because by
this time this data frame should have the the
right indexes so this means instead of
instead of this the letters and this is the same but starting with one instead
of starting with zero okay so let's
check we could include it as part of select data so here we're printing it
before select data so let's move this around and put it
after select data yes and then select data we'll we'll add
this stuff so that then it's hidden from the main
main part and it's all tidy here so right now we don't want to deal with
actually selecting the data but we're just going to process
here a bit so first of all we're going to comment all this stuff with salesman
and later we will change it and what we want
to do is uh a change here this
this indexes so first of all uh let's add some comments so that we
know what we're doing so we'll change the index
as in x3 and this means letters for columns
one based integers four rows okay so this is what we want
to do and then uh how do we do this uh
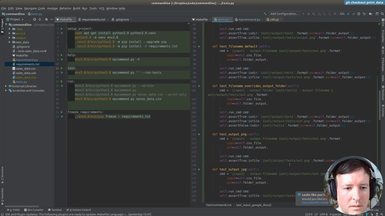
so basically i found this function there is part of one of the libraries we
use is open by xl
so this one one library we're using right
and um they have the documentation here and if you remember we're using this we
can see in the requirements open by excel right we're using it so
it's not an additional dependency so if there's anything this library offers
we can use it and it's for free let's say because we need it anyway
and so i was checking for a function that
that does literally this that gets like an index and gets it
as a letter index but with all the details you know how
how a spreadsheet does it so it needs to not only work until
set but also after it was for three four letters right so it works it's
solid and for this i found a function called
get column letter let's check the
recommendation get column letter no
let's see uh exactly let's see
here same module get column
there's different utilities here that we could use
but this is the one that we're interested in right opened by youtube's
cell get column letter conversation index into column letter so three
would turn into c here you can check the source code
we can also check it in intellij uh but let's let's import it and then we
can see exactly what it does so we're going to do here from
from this we import get column right then from intellij itself or we
can also check in the documentation as you see we took the time to set up
the project correctly and now the advantage is that
we can see here the source code right so it just links to it we get here the
documentation string and we can see also what other
functions are here there's the other direction right so
from leather to to integer but for now we only need this one so
just from the index to the to the letter
based index so what we can do to get this so
first of all we're going to need sprints on here so we want we want to
get the columns right so in pandas we can get the columns by
doing this in a list so let's just see here
let's just print these columns and exit just listing the values
so this will get the the columns of the of the data frame so this should be like
one two you know the number based columns
so let's just run this um with the sales data
yes which is the limit and these are the columns right starting
with zero and yeah so basically
just the indexes and we can transform this into
into the letters so how do we do that so first we're gonna have a place to
store this letter columns for the letter mapping of
the columns and then we're going to iterate these
columns do the transformation for each
and append it to this other list and later we'll change the columns to refer
to these letter columns instead so you see what i mean so basically we
have this function that column letter and then here we can pass element
and if we print here columns and letter columns
we should see here the one we saw with zero one
until four and here the equivalent so abc
so let's see if this works okay so this is a key error of zero
because we as we saw the columns are uh indexed by zero starting at zero
and uh this function doesn't like that right this function is
expect something that starts at one it's not obvious here but
now that we see the error it is so we can just add one
so all of them will stand as one two three
instead of zero one etcetera so if we print it now
okay you see here we got what what we want to try abc
so etc um so this is already working so this function really works
and then we only need to to say okay these letter columns
this need to be the new columns of the data frame
how do we do that so very easy with pandas we just assign it
letter columns that's it just that then let's comment this out
to see to see if it really worked okay and we see now we get the
letters here so this worked perfectly and uh we only we're only one step away
from doing this and this that this also needs to be like
indexed by one starting at one and not zero so what we can do for that is uh
basically uh well we can change the index just by assigning to the index
same as the columns but then here we want to assign like a range that is the
same as we have now but plus one and to do this we can use
one trick which is directly using numpy so numpy is a library
it's imported like this will be short shortening same as pandas is usually
imported with pd and enumpi is a library like a numerical calculation library
that pandas also uses and other libraries use
and basically here we just use it because it's shorter
to do it in number basically we can write this expression
and what this means is a range starting by on one ending on the length
of the data frame and it needs to be like
last one because we want to everything is moved to one right so instead of
starting at zero stars at one and the length plus one
and this will change the index so that now it will be
um starting on one so this is creates a it's a fancy way to create a range
of numbers so you you'll see it now when i run it
now we see the letters as before but also here it's starting
by one not by zero anymore and this is literally what we wanted to
do and with this we are ready to to start selecting data
the user can just come here and like run their comment which in this
case let's imagine the user is not running
this macro by running it like this so they're running like my command sales
data and then they see what what the data
looks like and they can like select somehow like
with some something like select select and then
here they will put an expression that will be so this would be something
like this select and then here they will put an
expression like like a3 to a8 and like this they will select the
data so this way they can see how the data
looks like they can select it all without leaving the command line so they
don't need to go open excel so this will be this will
make it much more usable um yeah easier to use and then
if you remember we had a text that we've written here so let's see if this test
runs successfully this time because now we
are really outputting all of this so it should work let's try and make
tests and they all work perfectly so this test
run we have the rest of the tests also so we
just run all of them to make sure that we didn't introduce
any mistake okay actually we introduced a lot of
mistakes so it's good that we tested um
so basically what is the problem here 15 uh 18 tests and 15 failed
it's good that we tested the the whole tests so what
happened here is that we change the behavior of
of the program right by default it's not creating any more
an output so all these all these tests that we have that create an output
like for instance is there one with by default f types
test filename default it must be one that has only
input for instance do we have one like that
let's check the error some of the errors is not the name of a
column okay yeah so sorry so the problem is
this plot function oh wait in the command
so the problem is here we're still hard coding the
the name of the salesman and and the week
so um for now it's not very good practice to commit uh things with
failing tests but um let's make an exception here and
commit it as it is with the print data and in the next
video we're gonna deal with this so we're gonna deal with this immediately
and basically we're gonna do this in a generic way
so we're gonna stop referring to this salesman
this week one and just really add some options so the user can select
their data so it will be similar to what we were writing
before like the user would write something like
something here select data for this axis select data for this other axis
with the range between a3 and like a7 something like this so for now let's
commit it and we're going to deal with this uh
selection of data in the next video let's add this and what we added here
is the new indexes right so excel like indexes letters columns
and we're gonna merge it so let's go to master
and merge print print data exactly and we merge it and
now we can push again and i notice we've been pushing like
this like you push origin and but i saw on the repo that it's only
pushing the main master so in in this case we're going to push
all the branches um it can be usually
maybe it could not be necessary but i just want to have all the branches
available so you can check every single step so for this you can
just use this all option and it should pull all the branches so
it should take exactly so it created these branches in
the remote so it's a useful option to have if you want to share the
branches like this and yeah so this way we have all the
branches
Clone the repository
git clone https://github.com/fromzerotofullstack/sheet2graph
and get the episode branch
git checkout print_data
Episodes
Ep.1 - Introduction, repo features and environment
(17 minutes)
We explain how the project will be structured and what we are trying to accomplish.
• Settings up the project
• Configuring a virtual environment
• Making a simple command that outputs a string

Ep.2 - Loading csv files
(8 minutes)
We create a Virtual environment and setup the project.
• Organizing commands with a Makefile
• Creating our Virtualenv
• Installing packages
• Using requirements.txt
• git branching
Ep.3 - First graphs
(19 minutes)
We save out first graph from the spreadsheet data.
• Installing Plotly to generate graphs
• Pip freeze requirements
• Solving dependency problems
• Using Pandas to do simple data processing

Ep.4 - Saving in a folder
(5 minutes)
We will create a folder to save our image to.
• Saving the image in a folder programmatically
• Using Pathlib
• Add folder to .gitignore

Ep.5 - First commandline options
(19 minutes)
We will add our first command line flags/options.
• Using argparse to parse commandline arguments and generate help
• Optional and required flags
• Add input file and graph type options
• Graph different graph types
• autogenerated help
Ep.6 - Output options
(22 minutes)
Here we add an option for different output locations.
• Using argparse to parse commandline arguments and generate help
• Combine options to output with a filename and with a folder
• Precendence of command flags
Ep.7 - Output format
(13 minutes)
We add Scalable Vector Graphics (SVG) output support.
• Add several output formats (svg, jpg, png) to our command
Ep.8 - Generated image size
(6 minutes)
We will add output options to specify the size of the generated graphs.
• New option for output size
• Default and custom graph sizes

Ep.9 - Refactoring and type checking
(22 minutes)
We start refactoring what we have until now, and add type annotations.
• Add basic annotations to functions
• Use Typeguard to enforce the annotations at runtime
• Annotations as a kind of documentation
• Add a new type of graph: the scatter graph
Ep.10 - Reading excel files
(16 minutes)
We will add support for Excel files (.xlsx).
• add dependencies: Openpyxl and Xlrd for Excel support
• Fix type errors

Ep.11 - Reading a file from Google Drive
(15 minutes)
In addition to a local file (.csv, .xlsx), we accept a Google Drive public document as input.
• Parsing the url address of the Google Drive document
• Adding the input option transparently for the user

Ep.12 - First tests
(16 minutes)
We will setup testing in our project to check the features we implemented.
• The unittest module in Python
• Add a test target to the Makefile
• Test loaders
• Assertions in testing
• Adding tests cache to .gitignore
Ep.13 - Testing helpers
(16 minutes)
Once we have the infrastructure for testing, we will write a few helpers to make the tests more concise and easier to write.
• Setup and teardown in a test suite
• Using Shutil to deal with filesystem operations
• Checking that a file is created in a specific path
• Checking the size of an image with PIL
• Running a command line application from a test

Ep.14 - Writing tests
(32 minutes)
After the testing infrastructure and helpers are ready, we are writing the tests for our commandline application.
• Testing input files
• Testing location of output files
• Testing generated image sizes
• Testing graph types
Ep.15 - Print version
(24 minutes)
We will be making our command a bit friendlier, improving the default behaviour with informative messages for the user.
• New option to print help of command
• Print version of the command
• Default behaviour. No flags prints the version and exits
• Testing the output of our command with os.system and subprocess
Ep.16 - Print data
(33 minutes)
After using hardcoded column names, we will start making the spreadsheet processing generic. This way our command will work with any spreadsheet file. The first step is to print the data of our input file, so the user can preview it.
• Print-only option to print the input file provided by the user
• Transforming the data with Pandas to index it by letter and 1-based integer (as in spreadsheet applications like Excel)
• Adding tests for the new indexing by letters and integer for columns and rows

Ep.17 - Testing data selection
(1 hour 3 minutes)
For each axis, we will allow the user to use expressions like 'b4,b5,b6,b7' or 'B4:B7' to select cells or ranges to graph.
• Add options '-x' and '-y' to select the data to be graphed
• Making the expressions case-insensitive
• Implementing a comma separated selection option
• Implementing a range selection option
• Adding tests first and making them pass after implementation, as in Test-Driven-Development (TDD)
• Better and more informative user messages in case of error
• Verifying and fixing problems in our Pandas implementation
Ep.18 - Adding labels to graphs
(25 minutes)
We will check everything is working so far and add extra options to set the axis labels to a custom user-defined value.
• Debugging broken tests and making all tests pass after all our changes
• Adding an x label and y label options to our command, to specify the labels in the horizontal and vertical axis
• Debugging column types in pandas
• Using exceptions to deal with unreliable cases
Ep.19 - Distributing our command
(57 minutes)
We will start preparing our command for distribution in pypi for it to be installable with pip, and testing the distribution in a test environment.
• Finding a proper name for our command
• Folder structure and necessary files
• Changes in the entry point of our program
• Generating a good README file in Markdown
• Examples and documentation
• Choosing a license
• Dependencies and versioning
• Setup.cfg and setup.py

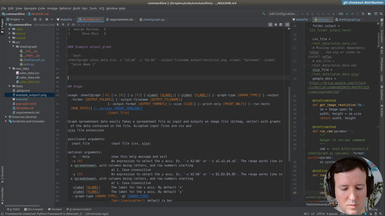
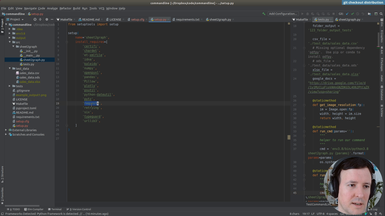
Ep.20 - Packaging and uploading
(20 minutes)
We have all the files. We will test the distribution at test.pypi.org before publishing it in the real repository. This way we will be able to fix any mistakes.
• How to test in the test.pypi.org environment
• Using Twine to distribute your module
• Creating a new account at testing (test.pypi.org)
• Secure tokens in .pypirc or interactively for testing
• Versioning increases with each code change
• Fixing errors and testing the new version in the test environment
• Problems with images as documentation in the README file

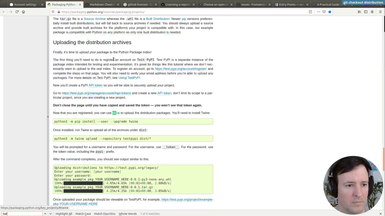
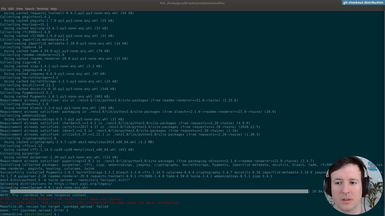
Ep.21 - Testing install
(19 minutes)
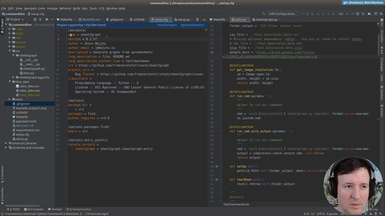
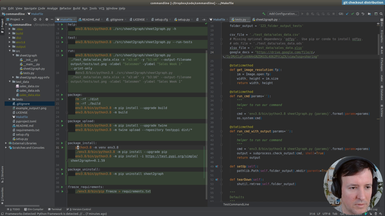
After testing at test.pypi.org, we will fix an error with the example image in the documentation and distribute our command 'sheet2graph' to the real production environemnt at pypi.org.
• Fixing error with images in README.md at test.pypi.org
• Creating a new account at production (pypi.org)
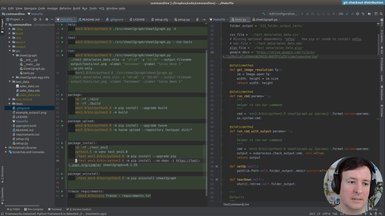
• New secure tokens in .pypirc or interactively for production
• Solving problems with secure tokens

Ep.22 - Uploading to production
(6 minutes)
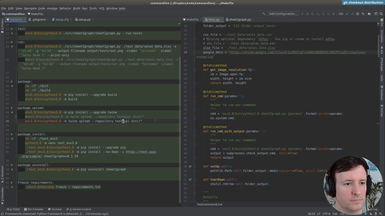
In this episode we put everything together and install our own command by typing 'pip install sheet2graph'. We test it both in a virtual environment and globally. We also talk about what this means to distribute code you develop easily to the world, something that now should be a lot more approachable. As always, we need to be mindful of publishing useful and tested code, and in general to play well within the ecosystem.
If you made it here I hoped you liked it. Subscribe or Connect with me on Twitter for updates on fromzerotofullstack.
• Solving problems with secure tokens
• Installing our new command using pip
• Testing on a new virtual environment
• Etiquette of publishing your modules and libraries
