sheet2graph command-line program
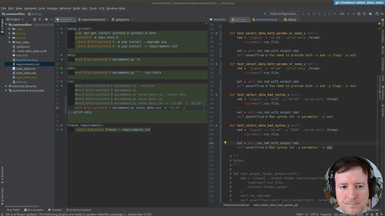
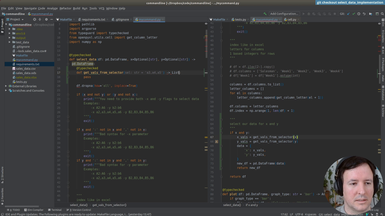
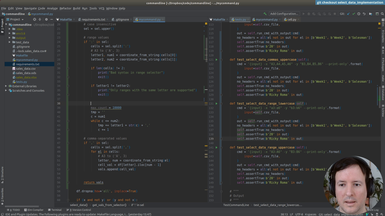
Ep.17 - Testing data selection
1 hour 3 minutes
For each axis, we will allow the user to use expressions like 'b4,b5,b6,b7' or 'B4:B7' to select cells or ranges to graph.
• Add options '-x' and '-y' to select the data to be graphed
• Making the expressions case-insensitive
• Implementing a comma separated selection option
• Implementing a range selection option
• Adding tests first and making them pass after implementation, as in Test-Driven-Development (TDD)
• Better and more informative user messages in case of error
• Verifying and fixing problems in our Pandas implementation
Notes
• Source code in Githubhttps://github.com/fromzerotofullstack/sheet2graph/tree/select_data_tests
Transcript
and now we can finally start thinking of the functional idea of
selecting data so what we want to do is have well first of all
let's create the the branch so we check out and we're going to call
this select data tests
and uh yes why because we're gonna write the tests first of the
of the functionality so uh what we want to do is
have an interface so if the user runs something like this
they print the contents of the file right and then we want to
have an interface where the user says for the axis x i want
these values let me open the file so they can say for the axis x i want
uh i don't know the salesman so that will be in the axis x and then
for the axis y of the graph i want like week two
and then how do we how can we do this so we saw in the previous uh
video that we have this uh range syntax and this good because it's something
that people are already using so if i want to select all the values in week
one this is just b4 colon b7
and the same for this is a4 a7 so let's just use this syntax in a as a
command flag so the users will be able to add
something like this a2 2 a6
and for convenience we're not gonna force them to to use uppercase
but it will actually be case insensitive so they will do something like this for
the x axis and for the y y-axis they'd be like b2 a6
so something like this could select some data and with this
it would be plotted so this is the interface where i mean for
now to implement this let's start adding some comment flags and some tests
so first of all we're going to need to go
here and add this x and y parameters let's add it close to the
input file exactly so something like this
and we're going to need an x and it's optional
default is none and the help the help should be quite detailed
so let's see the help is going to be okay an expression
to select the x-axis okay so this is accurate and then we're
going to give a few examples right because
it's a specific syntax so for this because we want to use single quotes
let's wrap this into double quotes instead
it is an example with single quotes and then we can give the example that
we're talking about here so that this a2 spreading uppercase first a2 to be
no to a6 this one way or
and actually with the x right so it will be like this
so this is one example uh this x a2
or other examples let's give one more example maybe
which would be like minus x and then it could be we also want okay
we have the range and we would also like to support this
uh just listing them so like a2 a3 a4 because it could also be useful right
you just list the ones why because maybe this example doesn't
make sense but maybe you want to list like this value this value this
value and this value instead of just a whole row so this
gives us flexibility and it will be easy to implement also so why
not add it here also um then a bit more of explanation
the range works like in a spreadsheet at one and then we want to say also this
case insensitive which is something that is possible to
see here already because this lowercase is uppercase but
just just in case some some people might think that the range
needs to be uppercase and this needs to be lowercase
so we just make it explicit and then we need the same for
the y parameter for the y-axis okay expression to select the y-axis
and now um here we have an opportunity of giving another example
i mean i'm not gonna go crazy with the example but i'm going to put here b
and here i'm going to put lowercase and this uppercase
just to kind of show that that both work so the examples cover
all the cases right there's an example for
uppercase range lowercase range and lowercase kind of listing of the
cells and uppercase listing of the cells and
the rest should be the same columns letters and this cases
so these are the arguments then as always we want to pass them here so
we're going to do x equals x
dot x the same for y here it is so now this if we run like
make help we should see here exactly our two new
positional arguments positional arguments
okay do we want this to be positional
no i think here we need to set this dash because we don't want this to be
positional so it's good that we tested the help
and now it's an optional argument like it should be with
x and y okay and case insensitive so now it looks
good it's not a positional argument right we need to pass this
x okay so now we have the the arguments now uh
with this we could start adding some tests
um yes probably it's one to do
first let's add it to the in the main method select data is gonna need this
right so let's just pass it here and we're
done with it here is going to be like x and this is
like a string so i don't know we could put an example here
of the string or maybe let's just set it as as known
and the same for y and down here we're passing them
and there's some mistake here here forgot a comma
an inside set of data exactly inside select data we want to have this
uh so here let's add this this type checked so maybe we can use the types
here to check that it's correct uh
there's this typing module that we're using here
for the any and it also has a useful type called optional
so we just import it also optional and this means that something can be the
value we provide or none right so this is a string or none so
a way to do to say this is that it's an optional
string and it's actually useful because we have
here we defaulted to none which makes sense of how the arcs work
so it makes total sense and then at the very last
function we type check it this needs to be
a string or none so i mean it doesn't need to be 100
but this will remove some of the some of some of the most common errors right
like passing an empty string or something like this
so um so now we what what we need to do so first we want to do two things
one is to write some tests before we implement this
and another is to have some proper error reporting because this
we just added two parameters but we added a lot of things that can go wrong
so uh basically um what did we add so if somebody passes
this data we always need to have both to have the x-axis and the y-axis to paint
the image right the image will be something
like this so we cannot draw this with just one
axis so this means that if somebody provides just one axis
we need to error and saying hey you forgot to add the y-axis or the x-axis
depending on what they added so let's see
um add all these errors here i think and and we need to be
informative with the error so we want to have a
a utility that users find easy to use so that means with error messages so for
instance if somebody provides the x this can be none or something else so
anything else unknown will be true if x and not y
so they only provide the x is an error or if y and not x
another way to have an error so this means they only provided one
and then we can say we're going to use this kind of
here doc syntax or this triple you can do i mean
probably you know but you can do with single or double quotes
and then it's multi-line okay so then we're gonna save here you
need to provide both right minus x and
my minus x dash y and flux to select data
data and we give some examples like it never hurts to give some examples
for instance minus x 2 36 minus y 2
e 6 is one example another example could be
with the comma syntax right so four five and like this example
and then the y as always here we can show an example that mixes
um cases you see that it doesn't matter and so something like this a good
example and and then so one
one error we want is when they provide one axis but not the other
but there's still a lot of errors right so here they can use
the column or they can use the the comma so this means if there's no colon and
there's no comma something went wrong right they can it's
not a valid expression so let's do if uh
so it doesn't x yeah and that's not a column
in x and not a comma next
then what then this was a mistake something wrong happened so
let's say that's interesting for the experimenters exactly so we're
gonna have one if for x and one x for y so that people can
know where that syntax was if it was
on x or y let's give another example so what's the example the example is
just forgetting one right so if we forget for instance
this one and for whatever reason it's difficult that we're forgetting all
of them but let's say if we could be like this any of this the
x would fail right so this is one and then we do the same
for y so just copy this and then maybe we can copy the example
from here again okay okay first of all this needs to be
white okay and well and when we
print these errors we exit which is the last thing
we want to show the user and then here is not for x but
for y and um
he's complaining okay so instead of not something in he's like is
english and comma nothing yeah okay so now the id doesn't complain but
syntax examples and then here we need an
example but for y so just remove this one this
will be a syntax error for y and the same here let me just solve this
and now we have two examples of syntax errors
with y but actually we don't want here an example of a syntax error
right we want the right thing so maybe maybe we can just keep the same example
you know three because we want an example of how to do
this right not how to to create the error this will be for the
tests so we're gonna do we're gonna be doing that in a second
okay so these are good examples without syntax errors okay so that makes
sense and so now we have this so let's just
test one of them here real quick so let's say we do this and we remove this
column you should see one of these examples
right exactly but syntax for x parameter so very good this
is the x parameter and we can do it with the others also
but instead of writing it here and just you know testing it every time manually
let's add some tests so um the tests uh
we have a section for this so let's just add a section to make it clear
here and we're going to call this selecting data
and then we want to have all these cases that we mentioned in the
that we have here basically these cases and that we're starting to test but we
want to test them automatically right so we will add them here
so let's just copy one of these and let's start testing so first we want
to test and that both axes are there
both flags for each axis are there so let's say test data
or none of them and there's gonna be let's just do one for now yeah
then um he's gonna have an input like a csv file
and then we're gonna have like an x which is gonna be like a2 a6
and that's it and print on oh yeah so basically we don't want to graph this
right so we're going to use the print only flag
here to make sure that this prints it yes and then for this we don't need the
output also we need this output only
okay and then what do we need to assert here
so we need to assert is that this is causing an error right
because if you run this it should cause an error like instead
let's say exactly so it arrows like this uh you
need to provide both exactly so we can take this
yeah just this is enough and then we're gonna
we're gonna check here that uh the binary string which is gonna be
based on the output from subprocess that this is enough
yeah so this means we're testing that this actually produces an error
um yeah this is a good idea then we can have um
let's commend the rest of the test for now
okay and then uh we're gonna have one like this
then we need to have one also when the user
only only provides let's say this is like x
and this is y and then when the user only provides y
exactly the same thing okay so these two tests already covered
these let's run it we just commented the other test to run
this faster but we will uncomment them later okay so this worked
and now we need to test so this is covering
this one right now we need to test this one so when the syntax on this
bad syntax so to do that let's copy one of these and we'll call
it select data but syntax
okay that sounds good syntax one maybe just and
what do we want here so we want to put both
so x and y so let's say maybe maybe this can be x
and y can be left with b let's get it and then this should
have a syntax error so let's introduce that syntax error here
um and then what we need to match is this syntax right
bad syntax for maybe you can even have like an x and y
version so this needs to be that syntax for x
and then okay so then we we have the same here we have like an x version
which will be that's index first parameter and a y version
and then we introduce the error in your y version and not this one
okay and then okay and this should cover all of these
cases so it covers the first one is covering
these oops and these two cover this for the
x and this for the white so this should cover already our basic error
our basic error messages um yeah let's run the tests
and they run okay perfect so this is uh this is working um then we're gonna have
a lot more uh tests later
um let's see with this we have covered the the tests
for the errors but we still need the tests uh for what we actually want to
implement right so what we're going to do now is we
write those tests and the next video will implement
the we'll make them pass basically so let's see
um we will have a syntax like this one to graph
some i mean it can be with print only or without um
yeah so like this we can also the back that we selected what we wanted
and then we're gonna need a few tests so let's write some of them so first
let's just copy one of these again and what tests are we gonna need so we
need to test that this data range works right so let's say select data
and maybe like range and we're gonna have like a lowercase and uppercase
because we set this case insensitive so they both need to
work so this will be the lower case and then
we will have from a2 to a6 let's just check that this is
correct so a2
to a6 okay um and to beat from b2
to b6 b2 to b6 okay so this should print this right salesman and weak
um yes since this is just for the test it's
good we could just select this instead or this
so for now this will do uh we'll just select this part of the
of the spreadsheet okay so let's add this example
with the correct one or lowercase uh with the print only and then we're
gonna need to test a couple of things we're gonna take this from this test
so first we don't need the output here because we're just texting
that it creates the that creates the files so it will be
something like this right we will be testing that it has
the default folder and the default
file okay so this would be one test so we test that it works that didn't
break and then he created the file and then we're going to have an
uppercase version of it this should also work
so it's going to be exactly the same but with
both uppercase so this would be like this a
and this will be uppercase b and the test will be exactly the same
here and then we also want to test the commas
so instead of range we test that commas work
okay and then let's say from a2 to a6
so something like this and the same from b2 to b6
test so this should cover the basic the basic tests we need to check and
uh yeah so right now this this test will break let's just run them
okay yeah so ten tests run and three so these last three
uh broke right uh usually it's not good to commit tests that are failing
but here we're gonna make an exception because in the next video we will
we will make them run right so that's that's our point here
um so let's let's just commit this and we can say like tests
and then there's two kinds of tests here right like
testing for errors in x y flags and
tests before implementing new functionality
okay so let's merge this into master
and this was called select data tests perfect and we will take it from here to
to implement so now it's time to implement the
the actual program and to make this tests pass
so first of all let's create a branch and we're gonna call this
select data implementation okay and then
what we need to do is uh to somehow make this syntax work there is a mistake
this is obviously basic um we want to make this uh data
selection work right so we're gonna have to
to change something inside the select data function
and how can we do this let's let's see so we're going to need
some kind of after we have processed the data so
let's say here when everything is correctly indexed
then we're going to need to select our data
for x and y this will make it so that
we can print right so if we select only a subset of the data
printing will only show that subset and also if we are really plotting and
not just printing if the print only option is disabled
then we will also generate the graph only of that subset
so this means it needs to to be here the select data
so select our data for x and y now basically if
both are present otherwise it will already error out
but just to double check let's add this check here
and then i'm going to have some somehow like
some values for x and some values for y right and so we'll have some kind of
function to select the values from x and some function to select the values from
my and then we will create like a new data
frame with this so we'll have something like in data frame
with the frame and then we'll return this
new data frame instead of the old one no instead of this one
um then how pandas does this is that you can create a new data frame from a
dictionary for instance and it will create with the columns that are in the
keys of the dictionary so it's quite easy
we can just do it like this so we'll be creating a data frame
that has a column x with the x values and a column y with the y
values so something like this and then we'll
pass the data here okay this will create a data frame
exactly with a column x and column y and then we just need to
find a way to select to select these values so let's see to
do that let me open
let me open the same file here on the left
and let's say we need some utility right but it's only
used inside the select data so what we can do is to
only add it here so python supports this inside like nested functions
so we just add another function here this way it's not accessible to
the outside world so we will call this like the valves from selector
okay and we'll type check it okay so what's going on this is in file
right the get values from selector and then we
will call it from here and what we want to do here is to get
the x value so the selector and use it to
really select the the values from the data frame so
we will be getting something like this so this could be an x value a2 column a6
and we'll be turning this into the actual values so it would be like
salesman nothing ricky roma shelley etc
and this magic is going to be happening in this in this function in this get
valves from selector so uh what do we need to pass to get bus
from selector um so for sure the selector let's say
which would be like x and that's it and it will return a list of
values so let's do this here
with x and y so this is a selector and this
method needs to transform the selector into uh
into an actual list uh so let's write this
you can write an example here for instance it could be a selector with
commas or with columns so we can do like this
for instance and also it needs a return value
in this case it's a list of strings so we type check it here too this list
is also available in the type module so you can just have
it and at least this will make sure that we
return a list of strings that we get a string based as a selector so it's not
like a hundred percent type checked but it
should get the main the main errors so it's still useful and
then what is this function going to do so
this is going to be a bit complex so at some point this function is going
to return some values so we just accumulate then here in this false
variable and then uh we set this case sensitive
right it needs to be case sensitive case insensitive because we are
accepting values with like this lowercase or uppercase so
one easy way to do that is to just transform the cell variable
to uppercase so it will always be uppercase so this way we just cut
the first problem in the end since the indexes
are uppercase we just transform whatever the user passes to uppercase and we
always be good then uh
this is uppercase and now we're gonna need
to deal with two cases basically so one case
one case is the comma separated values comma separated values
and the other case is the range values okay and then at some point you return
these values right so um there's these two different syntaxes
that we have to support so let's start by supporting the comma separated values
because it seems like it's easier right to implement this so
let's start with the easy case um okay so let's check
if the comma is in selector then we're in the comma separated value
selector right then what can we do here um
well if there's a comma here we can split by comma right so we'll have each
of these a3 a4 a5 in a list so let's do that
like cell dot split so this splits by comma
and then what could we call this we call this like cells
and then we can iterate on these cells for everything else
okay and now um here
um so we mentioned before that uh we're using before this function
called get column letter right here and this
good was taking an index and getting a letter
and now really want to do exactly the opposite here
so we have like a and we would like to get
a number so we can use this other coordinate from string no actually this
is not exactly what we want so what we want is to get from a3
we want to split a and three right so we can refer to the column
index and to the to the row index so this one
doesn't do exactly what we want the one that's what we want
is this one coordinate from string convert a coordinate string like b12 to
a double b12 so this is literally what we want so
this is from the same library we're using before so here we
look for it exactly so we can just import it
and then it makes this easier for us right from b12
we'll get like b on one side and 12 in another
and yeah it makes it a bit easier and it's already a library that we have so
why not we just include it here coordinate from string
and then this is going to be very useful here for us because
we can just use it uh to split this into so basically here we're gonna get get
coordinate string and from the element right this
element has like a two maybe you're going to put here like this
is like a3 for instance to
something like uh um
then this is a table so we can just assign like
the letter part and the numpad straight away and it should work
something is wrong here get coordinate coordinate yeah so it's
going to get coordinated but coordinate
and now i should remove this warning and now here we have the letter
and the number uh let's just print this to see that uh
we're not going too far away from what we want so
we clean this and we will just exit and then in the run
exactly we can use yeah we're going to use from a2
to a6 i'm printing let's try this okay so something went wrong um
let's make run so this is the comma right so we need to
try the comma one so let's try here like let's put the example 8
and let's say e3 before so the range one is still not
implemented right so we want to use the comma one
so now when we run it exactly so it's printing
a3 a4 a5 so and what this is is it is this part right this
so it does this three times and then it exits so it's working
well and then and at this point we have the letter and the number and these are
the indexes of our data frame that looks like this
so a is here and this is exactly indexed in the exactly the same way so
what we can do is use this to get the cell value so we can do
from the data frame we're gonna get the letter
to choose the column and then this i log which is like integrated location
you can think of like this and you can check here
i underneath so what this does is an integral
position base from 0 to whatever and basis to select
so if you have a data frame you can say give me the first row
or you know based on uh zero indexes so the first the second just with an index
and then what we're going to do is use this
to get the row so this selects first the column
and this x the row so for that is the number
and it needs to be minus one let's remember which was
indexed by one in the spreadsheet in the data frame
and here we're going to use the the integral location so it needs to be
based on zero so we remove one from this and with this we should have the cell
value and what do we do with the cell value so we add it
to the balance right so here we have tender value
so this should give us a list of values so let's just print it
exactly so this is actually working right it's selecting ricky roma
we we had a3 a4 a5 and if we go here this is a
three four five okay it's like minus one it looks like um
a3 a4 a5 so maybe let's try without this minus one just for a second
i think ben is not needed shelly george a3 a4 a5 so let's see
a3 a4 f5 so actually
not it's not a minus one but like a plus one right
so let's try that for a second yeah because it's indexed
by one let's move um
just to fully understand it out of bounds
um okay so what is happening here is that um we are removing the
nota numbers right so we see here we're moving the empty column so how can
we know this like if we just
print the the whole thing here right we can see then the indexes
so because some of the rows are skipped it doesn't match exactly the extras so
it's working actually correctly a3 should be a ricky roma right so let's
try it sorry and this was
minus one and now a3 is really wrong right so it
was correct so this needs to be one less because it's go
it goes from the one based index to the i
location which means like zero based index
and the confusion was that uh here we are removing the
the empty value so it's not a problem like our users will use
this to inspect the values so they will run
something like this and then this is the reference that they will have right
or we could also not ignore like whole values of nothing
like between these sales per week and salesman
but i think it's uh it's okay um so let's continue here we're appending the
values and we saw that here the values are selected correctly
and then this will happen for both values right so
uh right now we implemented only for comma separated values but
this is going to happen for x and for y so that's uh that's pretty
good and then uh we could start actually
checking this uh even with a plot so right now we have like the x values
and the i values then let's just run this
break okay because of the print only it's just printing the subset we
selected so we can verify that it works correctly
correctly but what happens if we remove the print
right then it will try to plot it
so not print only but the real deal plotting it let's see
okay then it breaks why because x is not a column name
right and where is this this isn't the plot function here we still have this
salesman so we need we need to fix this how do we fix this
easy now we are generating a data frame with the columns x and y
so we just use here x and y for any graph type instead of salesman
now it's not hardcoded anymore it's not going to x and y but it's only
always x and y so here and then this should generate our
graph so let's run it again
okay so it's run without a an error now let's see
if the file is generated and here it is so this graph
has like the x and y names by default and but it has all the data that we
wanted so it has like week one and it has like
our salesman here it's a withdrawal but we're gonna work
on improving this so let's take a look here
um what do we need to do so first we need to support another syntax
um let's see maybe we can start writing some tests because we just
implemented one so let's write some tests first
and then we can take it from there so here we have some tests with the
selection of commas let's run these tests first and see how
many of them break okay so test select the data commas
fail like three failed basically the range uppercase range lowercase okay so
almost all of the new ones failed right so the
lowercase and uppercase we expect them to fail because we didn't
implement them yet but the commas we would like to pass
so let's first make the commas test pass let's see what can be the mistake here
so print only input x a2 okay
uh it could be here that basically a2 is uh
is too early right a2 might be a salesman and maybe
here when it's time to draw it picks week one
so i think it's just a bad example we included in the test here
well if we start from here this should work so let's just give it a
try now okay you still failed so false is not
true uh out outpost output test it seems the
the selection is correct because there's no salesman or weak
it's just the data okay
so it's failing out of logic um let's see first of all uh-huh
okay actually here we're not testing the right things right
we want to test here the the output okay so let's do something here this
test needs to be about the output so we'll do here like
one command with output and then we'll test different things one test
that some some values are here right so um
because this is print only of course so this test was internet to test that
that the output is correct right so one test that the selected part
this is this so what we can do here is um first of all
we can just test that there's certain values right so
we're going to test that this 20 is here and then this
ricky romance here so it's not like a perfect test but this
should be a good heuristic because we are we are
hardcoding the test data right so for the test at least we know that this is
going to be here so 20 needs to be in the output and
also uh ricky roman institute output and then um we also want to test
that these headers we want for salesman are not in the in the file because we're
selecting on purpose before it was like a2
and b2 but we're selecting on purpose uh after those so let's just check that
those don't appear this means the filtering is correct right
so to do that we're going to use the same trick we used before with the
list comprehension and we're gonna have here
like a small expression with the things that we don't want to
match so for instance week one week two and maybe one of the other ones
like uh salesman here for instance okay and then we have for element
in this list so we want all of this not to be present
right and we can store this in a variable no
headers and and we assert
no others so this is checking that none of these headers is in the output
okay now we can run this again and it should pass
okay so i test passed so that's good and um when i do this
for both lowercase and uppercase right so
let's add also here data commas lowercase we create another one
for uppercase with exactly the same output and
tests so uppercase only here we're going to change the case
okay and here they'll be the same okay so now it's uppercase this should
also pass we'll try in a second and yeah and then
we're gonna go into the the range right these ones that we
commented out yes so let's just check that this passes
which will be a problem okay this passes and and then
now i want to implement the range syntax so we wrote these tests
before um let's also change this all a2 to like a3 because we know
we want to select from the a3 and for both lowercase and uppercase um
and also we don't want to test for the files because we're using the print only
so here we made a mistake and we want instead to add exactly the
same test as here yes so this one
and we also want to test the output rate of the command
so we remove all of this and we will use this one exactly
so we're going to check that the output is is the same with the range syntax
in the text that these headers are not there
and now they should break before we implement it so let's run the test to
see that it breaks and there it is to break right and it's
these two faults is not true exactly so we need to
implement here the range values so this seems it's not very very
difficult but it's a bit tricky right we need to get
something like like let's change this to a range value
we need to change i'm going to get something like
from a3 to a6 like this mp3 could be six
so we need to start with a3 and then go like a4 a5
a6 and this so i think an an easy way to approach this is that
um we already have the comma separated values
so what we can do is just expand this into the comma separated values
so we're going to split it before and whenever somebody sends a range value
we're going to expand it into the comma value and then the comma logic here will
pick up so it's like a very easy approach and i
think it's uh it's worth it so what we can do here is
same as before if there's a column insert
in cell then we split but this time by the column
exactly and now we have the same logic right
um so we're gonna get from the coordinate and
the letters but this time we only have two coordinates here so we can just
straight away instead of iterating you just access
that this will get a letter one and this will
be the number one and then the same for two and this index
is one yes so we're splitting when we're
splitting like this uh this is like selection split
um there's only two right so there's a three a6
so when we split we'll have a three on one side a6 on the other and from there
letter one will be a number one will be three letter one will be a number one
with six and so far we support only the same
letters so we have to think about those possibilities of
having a one two c twenty four um so for now we get
here the letter one in an ordered way and the letter two
number one number two then uh we want to just add like some
minor error handling so we can say if the letter of cell is
not true sorry the length of cells
is not true and something went wrong and also if the letters
are not the same right so here something and then if
letter one is different we don't support this as we said so
let's just print the message here saying like only ranges with
and then here it means something went wrong like
we can print like syntax error or maybe like that but sometimes
and it breaks like we could of course add these to the tests
we have to find a compromise between testing everything and
like testing the things that can can go wrong so for now
these i'm not going to test yet but it could of course be a possibility to add
these errors we just don't want to have to duplicate every error in
a test if it's uh simple enough
so yeah i think for now this we're gonna look like this without the test
and then what we need to do is now we have the beginning
and the end so we'll have like a three we have here like a and three and here
we have a and six so we need to kind of
interpolate between these two values right we need to
create this a4 f5 a6 so to do this we're gonna
we're gonna we're gonna do this logic ourselves so here we accumulate
the value and we're gonna have a counter and then we're gonna have this logic
well the counter is less than the number two so six
uh yes so like this then we accumulate the value on this 10 variable
and the value accumulate is letter one plus string version of the counter
this means if the counter is at the beginning three
the first iteration here will be a3 the second one will be a4
and it's gonna go until the counter is bigger than number two so well it's
smaller or equal and then we're gonna need a comma
also uh because we're expanding this to the coma version
right so it needs to be like a3 comma a4 so in the end it's gonna be a3 comma
a4 comma and we're going to need to increment
this counter also or it's going to be stuck
on an infinite loop yes it's going to be something like this
then because we're using this while and maybe we make some mistake here and we
can trigger an infinite loop i'm gonna
add here like a max count just to give some limit to this just in
case i made something wrong here this other
one the user's computer to go into an
infinite loop and like log or something like this
um so let's add here some comment as to why
yeah so basically there could be some mistake that we're not thinking about
now in the syntax of the range and whatever happens i
don't want it to go over this maximum count right so maybe
it's not necessary but it has some confidence that
nothing too bad can happen so here i'm going to add another check
so if the counter goes over the maximum count
and this will also and counter under the maximum count this will also
stop so this is good and then we are accumulating this so this is also
correct and maybe we want to see how this looks like at this point so
let's print this temp and we need an exit and we
need to test this with a with a range value right so we have here
range value so we should just run it and we'll see the values that it prints
okay so we see here that it's working so it's a3 a45 so it's expanding correctly
the only thing i don't like here is that it ends with a comma
and that's not how the syntax works right the syntax should be without a
final comma so we need to add a comma in between but
not at the end so let's fix that and what we can do
is um here we just check right at the very end we check is this
like a we check here is this
ending in a comma so if 10 ends with a comma
then we're gonna remove it so simple as that uh
and with python we can use the syntax to remove the last character
so it's like a copy of the string without the last character
and and that's it and then where are we going to store this so
right now we're storing it in time check that this is valid if you want
so here you see that the comma is not there anymore um
but then we want to change it here to the
to the code that passes the comma separate value so the easiest way here
is that we just save it into cell so this way this
will expand uh the colon in cell and then the next one will pick up
because here there's nothing else or anything so we'll just pick up from here
so this should make it work and this should make our test
pass actually so let's just try to run the tests
perfect so they run so now it's also working with the
range so also something here where we're running the test still with the old
empty input file like it doesn't matter but
i'm gonna remove it because the input file is now not mandatory
so they should work still the same and they run perfect so this means this
runs properly so we implemented the range and
the range syntax and the comma syntax and now let's just make sure that we
didn't break anything else by running the other tests
so let's run all the tests now okay and we broke a few things right so
we're getting this before and uh yeah let's see what what their
expected one of abcde yeah so i think okay let's let's wait until it finishes
but yeah from 26 is that before
we didn't have a this selecting syntax right we don't have this
x and y so what happens that when we wrote the tests
we didn't write any selector so now all of them need a selector so
what we can do is just add this part to all of those tests
right so for instance even if this is just in the output folder it
also needs this parameter so i'm just going to add this to all of
them it's not positional but i'm going to add
it here so it looks the same and then they should do this selection
which is now mandatory right if you want to print something now it's not
hardcoded it's not just saying take week one
it's just taking whatever you add in the selection so okay i'm almost there
um then the input ready for some of this is not necessary but i think almost for
all of them it is okay so if i had i haven't thought of
this and now if i around the test i think
they should be correct because now we have a selector right so
we're printing some data so let's see if they run
okay there's still a couple a couple of errors
so let's try to fix them there's one one test that failed let's see which one it
is and we will fix it okay so two failed
uh so the ones that failed are like test input google docs
and test input um xlsx
Clone the repository
git clone https://github.com/fromzerotofullstack/sheet2graph
and get the episode branch
git checkout select_data_tests
Episodes
Ep.1 - Introduction, repo features and environment
(17 minutes)
We explain how the project will be structured and what we are trying to accomplish.
• Settings up the project
• Configuring a virtual environment
• Making a simple command that outputs a string

Ep.2 - Loading csv files
(8 minutes)
We create a Virtual environment and setup the project.
• Organizing commands with a Makefile
• Creating our Virtualenv
• Installing packages
• Using requirements.txt
• git branching
Ep.3 - First graphs
(19 minutes)
We save out first graph from the spreadsheet data.
• Installing Plotly to generate graphs
• Pip freeze requirements
• Solving dependency problems
• Using Pandas to do simple data processing

Ep.4 - Saving in a folder
(5 minutes)
We will create a folder to save our image to.
• Saving the image in a folder programmatically
• Using Pathlib
• Add folder to .gitignore

Ep.5 - First commandline options
(19 minutes)
We will add our first command line flags/options.
• Using argparse to parse commandline arguments and generate help
• Optional and required flags
• Add input file and graph type options
• Graph different graph types
• autogenerated help

Ep.6 - Output options
(22 minutes)
Here we add an option for different output locations.
• Using argparse to parse commandline arguments and generate help
• Combine options to output with a filename and with a folder
• Precendence of command flags

Ep.7 - Output format
(13 minutes)
We add Scalable Vector Graphics (SVG) output support.
• Add several output formats (svg, jpg, png) to our command

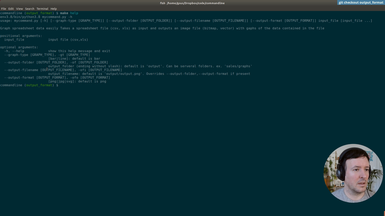
Ep.8 - Generated image size
(6 minutes)
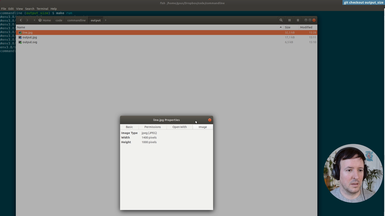
We will add output options to specify the size of the generated graphs.
• New option for output size
• Default and custom graph sizes

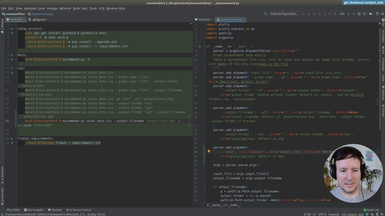
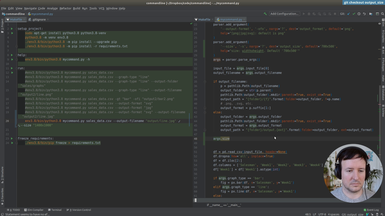
Ep.9 - Refactoring and type checking
(22 minutes)
We start refactoring what we have until now, and add type annotations.
• Add basic annotations to functions
• Use Typeguard to enforce the annotations at runtime
• Annotations as a kind of documentation
• Add a new type of graph: the scatter graph
Ep.10 - Reading excel files
(16 minutes)
We will add support for Excel files (.xlsx).
• add dependencies: Openpyxl and Xlrd for Excel support
• Fix type errors

Ep.11 - Reading a file from Google Drive
(15 minutes)
In addition to a local file (.csv, .xlsx), we accept a Google Drive public document as input.
• Parsing the url address of the Google Drive document
• Adding the input option transparently for the user

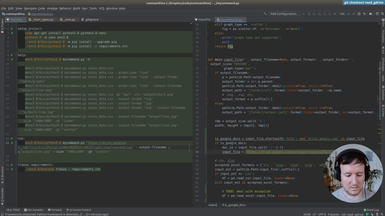
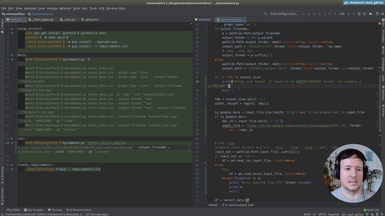
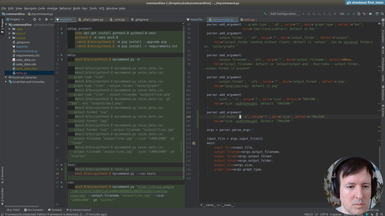
Ep.12 - First tests
(16 minutes)
We will setup testing in our project to check the features we implemented.
• The unittest module in Python
• Add a test target to the Makefile
• Test loaders
• Assertions in testing
• Adding tests cache to .gitignore
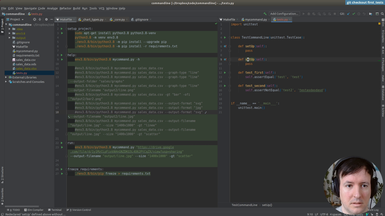
Ep.13 - Testing helpers
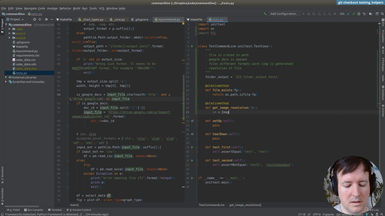
(16 minutes)
Once we have the infrastructure for testing, we will write a few helpers to make the tests more concise and easier to write.
• Setup and teardown in a test suite
• Using Shutil to deal with filesystem operations
• Checking that a file is created in a specific path
• Checking the size of an image with PIL
• Running a command line application from a test

Ep.14 - Writing tests
(32 minutes)
After the testing infrastructure and helpers are ready, we are writing the tests for our commandline application.
• Testing input files
• Testing location of output files
• Testing generated image sizes
• Testing graph types
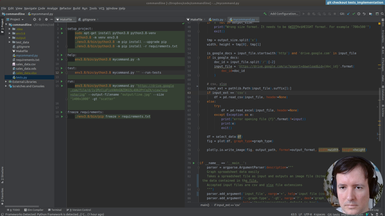
Ep.15 - Print version
(24 minutes)
We will be making our command a bit friendlier, improving the default behaviour with informative messages for the user.
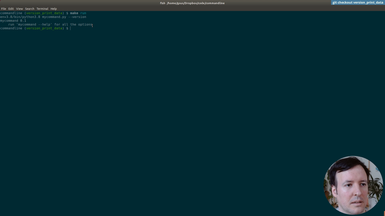
• New option to print help of command
• Print version of the command
• Default behaviour. No flags prints the version and exits
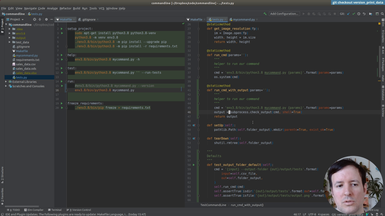
• Testing the output of our command with os.system and subprocess
Ep.16 - Print data
(33 minutes)
After using hardcoded column names, we will start making the spreadsheet processing generic. This way our command will work with any spreadsheet file. The first step is to print the data of our input file, so the user can preview it.
• Print-only option to print the input file provided by the user
• Transforming the data with Pandas to index it by letter and 1-based integer (as in spreadsheet applications like Excel)
• Adding tests for the new indexing by letters and integer for columns and rows

Ep.17 - Testing data selection
(1 hour 3 minutes)
For each axis, we will allow the user to use expressions like 'b4,b5,b6,b7' or 'B4:B7' to select cells or ranges to graph.
• Add options '-x' and '-y' to select the data to be graphed
• Making the expressions case-insensitive
• Implementing a comma separated selection option
• Implementing a range selection option
• Adding tests first and making them pass after implementation, as in Test-Driven-Development (TDD)
• Better and more informative user messages in case of error
• Verifying and fixing problems in our Pandas implementation
Ep.18 - Adding labels to graphs
(25 minutes)
We will check everything is working so far and add extra options to set the axis labels to a custom user-defined value.
• Debugging broken tests and making all tests pass after all our changes
• Adding an x label and y label options to our command, to specify the labels in the horizontal and vertical axis
• Debugging column types in pandas
• Using exceptions to deal with unreliable cases
Ep.19 - Distributing our command
(57 minutes)
We will start preparing our command for distribution in pypi for it to be installable with pip, and testing the distribution in a test environment.
• Finding a proper name for our command
• Folder structure and necessary files
• Changes in the entry point of our program
• Generating a good README file in Markdown
• Examples and documentation
• Choosing a license
• Dependencies and versioning
• Setup.cfg and setup.py

Ep.20 - Packaging and uploading
(20 minutes)
We have all the files. We will test the distribution at test.pypi.org before publishing it in the real repository. This way we will be able to fix any mistakes.
• How to test in the test.pypi.org environment
• Using Twine to distribute your module
• Creating a new account at testing (test.pypi.org)
• Secure tokens in .pypirc or interactively for testing
• Versioning increases with each code change
• Fixing errors and testing the new version in the test environment
• Problems with images as documentation in the README file

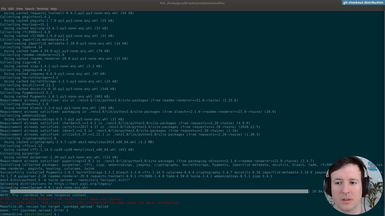
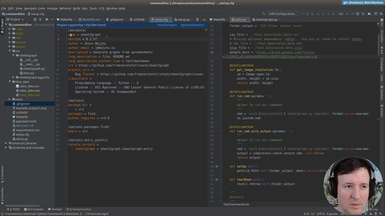
Ep.21 - Testing install
(19 minutes)
After testing at test.pypi.org, we will fix an error with the example image in the documentation and distribute our command 'sheet2graph' to the real production environemnt at pypi.org.
• Fixing error with images in README.md at test.pypi.org
• Creating a new account at production (pypi.org)
• New secure tokens in .pypirc or interactively for production
• Solving problems with secure tokens

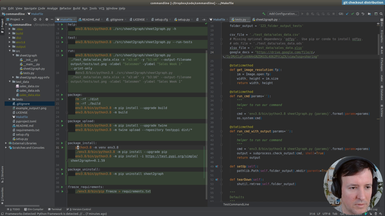
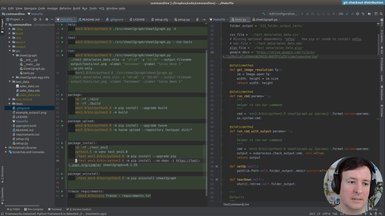
Ep.22 - Uploading to production
(6 minutes)
In this episode we put everything together and install our own command by typing 'pip install sheet2graph'. We test it both in a virtual environment and globally. We also talk about what this means to distribute code you develop easily to the world, something that now should be a lot more approachable. As always, we need to be mindful of publishing useful and tested code, and in general to play well within the ecosystem.
If you made it here I hoped you liked it. Subscribe or Connect with me on Twitter for updates on fromzerotofullstack.
• Solving problems with secure tokens
• Installing our new command using pip
• Testing on a new virtual environment
• Etiquette of publishing your modules and libraries

